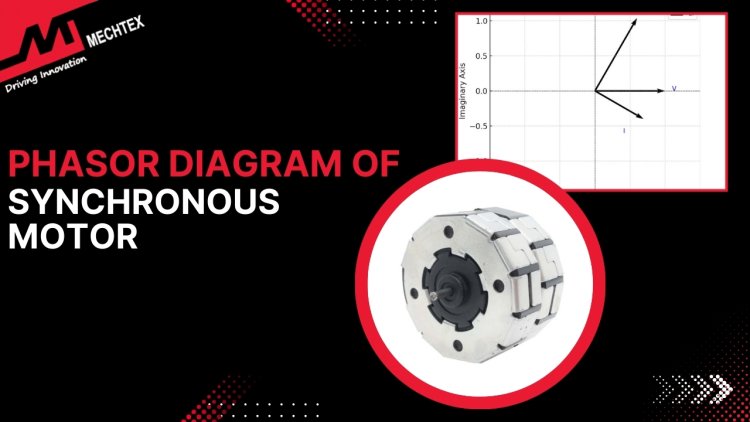
Phasor Diagram of Synchronous Motor: Voltage, Current & Power Factor Relationships
A clear guide to phasor diagrams for synchronous motors show the relationships between terminal voltage, induced EMF and armature current under lagging, unity, and leading power factor conditions.
Synchronous motors are pivotal components in industrial applications due to their constant speed operation and power factor correction capabilities. A critical tool for understanding their operation is a phasor diagram which graphically represents the relationship between voltage, current, and internal quantities like induced EMF.
This blog explores phasor diagrams, their significance, and the various factors influencing synchronous motor performance.
What is a Synchronous Motor?
A synchronous motor is an AC motor that operates at a constant speed synchronised with the frequency of the AC supply. Unlike induction motors, the rotor of a synchronous motor rotates at a constant speed as the stator's rotating magnetic field, hence it is called a "synchronous motor".
The Construction of synchronous motor includes two parts:
Stator: It is the stationary part of synchronous motor. It contains a three-phase winding energised with an AC power supply and generates rotating magnetic field.
Rotor: It is equipped with either permanent magnets or electromagnetic windings supplied with DC excitation. It rotates at the same speed as the stator's magnetic field.
Watch the YouTube video by "Sabins Civil Engineering" to know about the working of synchronous motor
The working principle of a synchronous motor involves energising of stator with three-phase AC supply and creates a rotating magnetic field. The rotor interacts with this rotating magnetic field and moves at constant speed.
However, initially rotor cannot follow the path due to inertia. Therefore, synchronous motors are not self-starting and require starting methods such as damper winding, auxiliary motor, or variable frequency drive to bring the rotor close to the synchronous speed.
Once the rotor reaches its synchronous speed, the magnetic field of the rotor locks with the stator magnetic field and runs in synchronism without any slip..
The formula for synchronous speed is:
Ns = (120 × f) / P
where f = frequency (Hz), and P = number of poles.
Advantages of Synchronous motors are:
Constant Speed Operation: It maintains constant (fixed) speed regardless of variation in load.
High Efficiency: Provide high efficiency compared to other AC motors, especially at full load.
Power Factor Correction: It can operate at a leading power factor in over-excited condition
Synchronous motors are used in pumps, compressors, conveyors, mills, and power factor correction systems in industries like cement, steel, textiles, and HVAC.
Phasor Diagram of Synchronous Motor
A phasor diagram of synchronous motor is a graphical representation used to represent the phase relationships between the electrical quantities, such as v within the synchronous motor. It helps visualise how these quantities interact under different operating conditions like varying load and excitation levels.
In synchronous motor, the stator is supplied with three-phase AC supply to excite the rotor. This results in generating a rotating magnetic field. causing the rotor to rotate at synchronous speed. However, due to the presence of reactance and resistance, sometimes voltage drop occur inside the synchronous motor and affects its performance.
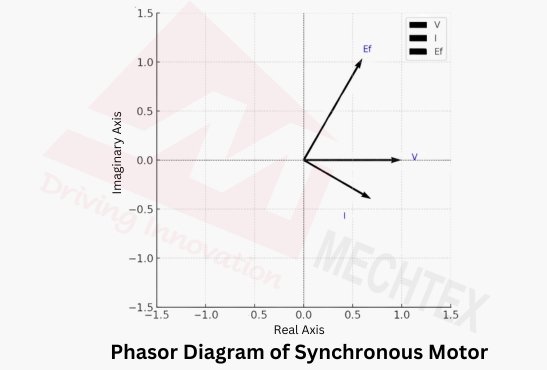
The phasor diagram illustrates:
- The relationship between terminal voltage, internal EMF and armature current.
- How does the power factor change at different excitation conditions (lagging, unity, or leading)
- The torque angle which indicates the amount of load the motor is carrying.
By analysing the phasor diagram, one can determine whether the synchronous motor is under-excited, normally excited or over-excited, which affects its reactive power behaviour and system power factor.
Also Read
What is a Synchronous Motor? | Construction, Working Principle and Applications
Components of a Phasor Diagram for Synchronous Motors
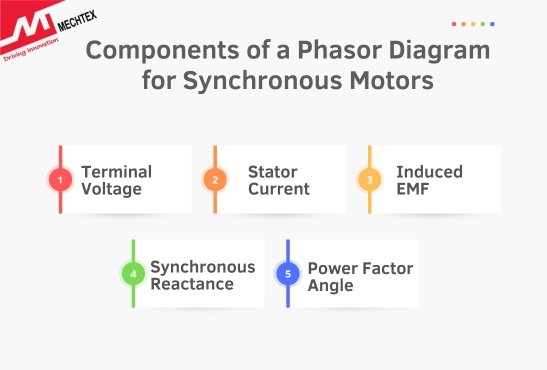
- Terminal Voltage (V)
Represents the voltage supplied to the stator of the synchronous motor. It serves as a reference phasor in most diagrams.
- Stator Current (I)
Represents the current drawn by the stator winding shown at a specific angle based on its load and power factor.
- Induced EMF (Ef)
Represents the internal voltage induced by the rotor’s field excitation which is critical for determining the synchronous motor power output.
- Synchronous Reactance (Xs)
Represents the opposition to the current flow due to the synchronous motor’s inductance, showing perpendicular to Stator Current (I).
- Power Factor Angle (Ï•)
The angle between V and I indicates whether the synchronous motor is operating in a leading, lagging, or unity power factor condition.
Importance of Phasor Diagram
Phasor diagrams are essential in understanding the operation and performance of synchronous motors. They graphically represent the relationship between voltage, current, and other electrical parameters in the motor, enabling precise analysis of its behaviour under varying conditions. The key importance of the phasor diagram is:
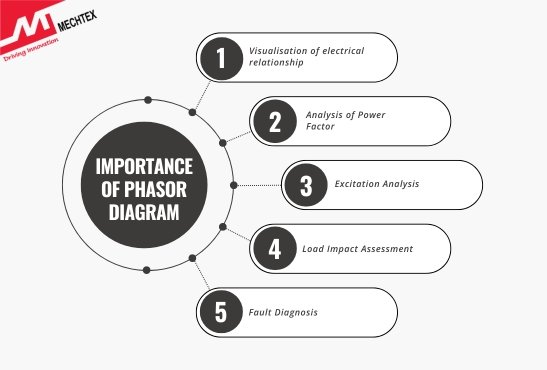
- Visualisation of electrical relationship
The phasor diagram depicts the phase relationship between stator voltage(V), stator current(I) and excitation voltage(Ef). This visualisation helps in understanding how these electrical quantities interact in real time.
- Analysis of Power Factor
By analysing the angle between the current and voltage phasors, the power factor of the synchronous motor can be determined. This is critical for optimising the motor’s efficiency and reducing energy costs.
- Excitation Analysis
Phasor diagrams help evaluate the effect of over-excitation and under-excitation. This is crucial for maintaining the synchronous motor’s stable operation and preventing issues like hunting and overheating.
- Load Impact Assessment
As the synchronous motor load changes, the phasor diagram shifts and shows variation in the current magnitude and power factor. This allows engineers to predict synchronous motor performance under different load conditions.
- Fault Diagnosis
Any abnormalities in the phasor diagram indicate potential faults such as issues in excitation systems, faults in winding, uneven load etc.
Excitation Conditions and Phasor Diagrams
The performance and power factor of a synchronous motor are closely related to the level of excitation. Excitation refers to the DC current supplied to the rotor windings which generate the magnetic field necessary for synchronous motor operation.
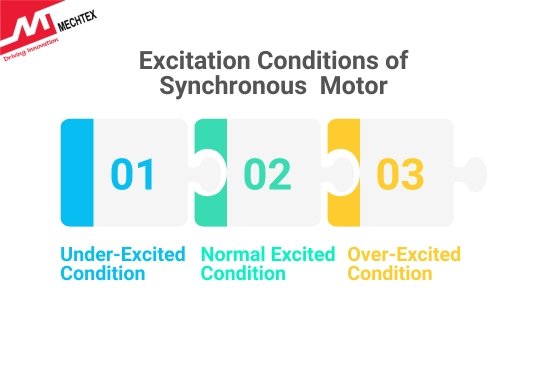
The excitation condition can be classified into three types: under-excited, normally excited, and over-excited. Each condition influences the synchronous motor's power factor and load characteristics, which are illustrated with phasor diagrams.
Under-Excited Condition
In an under-excited condition, the field current (I) is insufficient to generate the required magnetic field. As a result, the back EMF (Ef) produced by the rotor is smaller than the applied voltage. This imbalance causes the synchronous motor to operate at a lagging power factor.
Phasor Diagram Representation:
- Ef is represented as a smaller vector compared to V
- I is shown lagging V by a phase angle (Ï•), signifying inductive behaviour.
- The resultant magnetic flux is less than optimal, leading to reduced efficiency.
Normal Excitation Condition
In a normal excited condition, the field current is adjusted such that the rotor magnetic field is precisely sufficient to counterbalance the applied stator voltage (V). As a result, the back EMF (Ef) is equal in magnitude to the voltage (V). The synchronous motor operates at unity power, where the current (I) is in the phase with voltage (V).
Phasor Diagram Representation:
- Ef aligns in both magnitude and phase with V
- I am in phase with V, forming a straight line on the phasor diagram.
- The synchronous motor operates at its most efficient point, delivering active power without reactive components.
Over-Excited Condition
In an over-excited condition, the current (I) exceeds the required level and produces a back EMF (Ef) greater than the voltage (V). The synchronous motor now operates at the leading power factor and behaves like a capacitive load.
Phasor Diagram Representation:
- E is represented as a larger vector compared to V
- I lead by V a phase angle (Ï•), indicating capacitive behaviour.
- The resultant magnetic flux is higher than optimal, which can lead to excessive heating if not controlled.
Also Read
Load Characteristics of Synchronous Motor
Conclusion
Phasor diagrams are a cornerstone of synchronous motor analysis, providing invaluable insights into their performance. By visualising the interplay of voltage, current, and back EMF, one can design, operate, and maintain synchronous motors more effectively. Whether adjusting excitation to optimise power factor or mastering phasor diagrams ensures the reliable and efficient operation of synchronous motors in diverse applications.